Careers
ETBD graduates have found success in a wide array of careers; some of these are
- social media and digital marketing
- experience design
- app/web development
- UI/UX
- games design and development
- VR/AR
- broadcasting and media
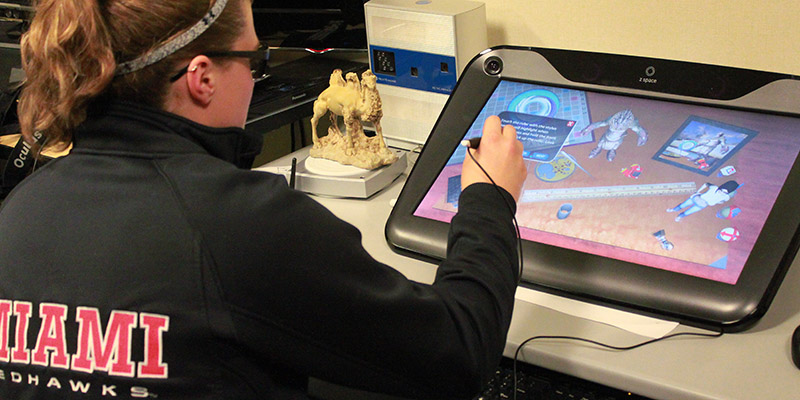

The Department of Emerging Technology in Business and Design (ETBD) explores how new technology can effect positive change in almost any aspect of society. The program, strongly transdisciplinary, comprises faculty from the worlds of business and design, obviously, but also from data science, engineering, programming, the arts, and the humanities.
The program offers two undergraduate degrees, one in ETBD and one in Games + Simulation. The Master in Entrepreneurship and Emerging Technology (MEET) brings together innovators from all academic backgrounds in order to gain the marketable skills required by top employers and become a well-rounded leader who excels in both entrepreneurship and emerging technology.
Graduates of the undergraduate and graduate programs often find themselves working as startup founders, digital marketers, growth hackers, social media marketers, UX designers, and more.
Curious to explore the dynamic learning environment and cutting-edge facilities that shape our innovative programs? We invite you to schedule a personalized tour of our campus, where you can witness firsthand the vibrant community and collaborative spaces that foster creativity and innovation. Schedule your tour today and take the first step toward an exciting academic adventure that will prepare you for success.

ETBD graduates have found success in a wide array of careers; some of these are

In addition to its two major programs, ETBD offers various minors and certificates, as well as courses open to all University students.